Refractive Index as a PAT Tool to Monitor Solid Phase Oligonucleotide Synthesis
John Lopez PhD, Senior Expert Science & Technology, Novartis AG
Dr. John Lopez shared that the inspiration for using the refractive index to monitor solid phase oligonucleotide synthesis (SPOS) came from one of his hobbies, which is homebrewing. While he was using a simple tool to measure sugar content in solution, he thought of a similar measurement application for chemistry.
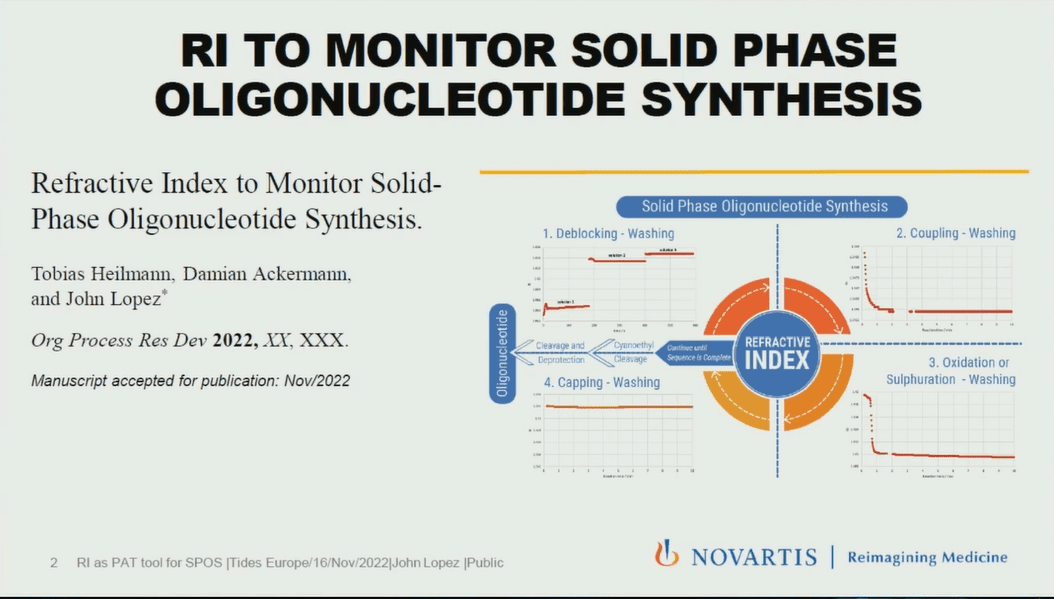
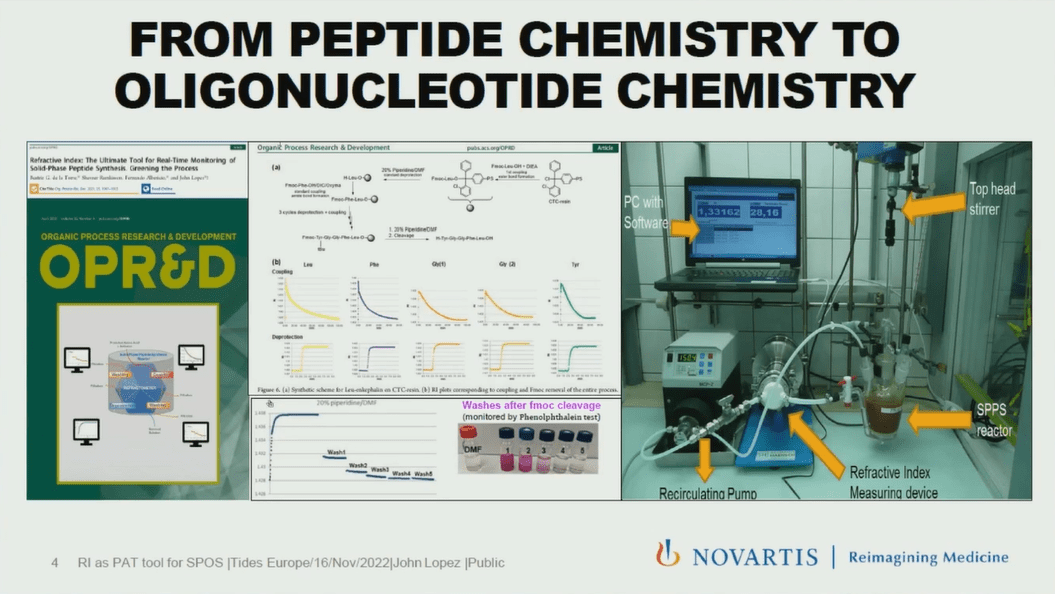
Dr. Lopez mentioned the similarities between peptide and oligo synthesis in terms of solid-phase synthesis, stages of deblocking, deprotection, coupling, capping, and so on. Only in the deblocking and deprotection steps, monitoring PAT tools based on UV-Vis are present. He mentioned the steps in between as blind boxes that we have no control over. He also added that the refractive index as a measure has been mostly used in the food industry but never in peptide and oligonucleotide synthesis. In successive studies, they evaluated the potential of the refractive index to monitor the process of SPOS.
Dr. Lopez showed an example of a refractometer used in the food industry. It is a large instrument that needs to be modified to be used for other experiments in the laboratory. The principle of refractometer measurement is based on the refractive index, which is the speed at which light travels in a liquid when something is dissolved. In modern refractometers, the change in speed can be tracked using laser beams. Their planned device is a refractometer implemented into the process of SPOS to get data to see what is happening at certain points in time without disrupting the process.
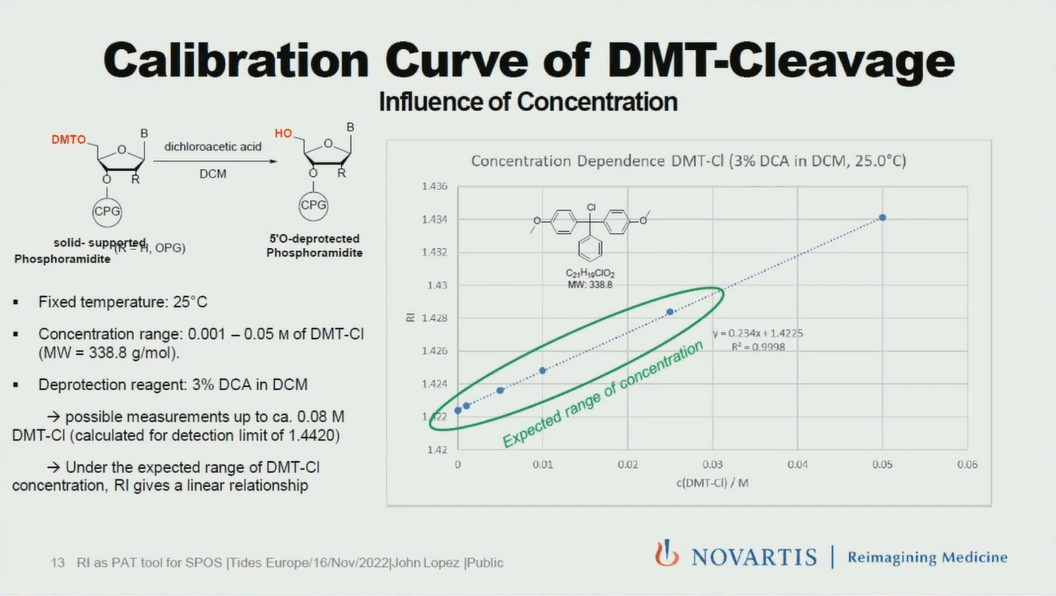
Dr. Lopez continued his presentation with measurement data. Calibration curves of amidites showed that for a given concentration of phosphoramidites, the refractive index changes in parallel with temperature. The good news is that RI showed a consistent temperature dependence in a linear fashion. In addition to phosphoramidites, it is possible to predict MW from RI and vice versa at a given concentration and temperature. They also showed that RI can be used to follow the typical working concentration range. They then carried out an experiment to simulate coupling reactions in the presence of phosphoramidites and activators. The region of the refractive index that varies at the beginning and end of the coupling reaction indicates when the reaction is complete. Dr Lopez also shared the calibration curve data showing that following DMT deprotection is possible with this tool. One of the potential limitations of the tool is following the cyanoethyl (CE) cleavage stage of the synthesis, as the refractive index of the amine solution is very close to the CE.
In the next part of his talk, Dr. Lopez summarized what they have done to monitor a SPOS of a 3-mer with RI. He showed a comprehensive figure including the steps (below) and the corresponding graphs.
Step 1:
Deblocking
Coupling
Washing
Oxidation
Step 2:
Sulfurization
Step 3:
CE-cleavage
C&D (AMA)
Regarding the manual synthesis of a 3-mer, Dr. Lopez said that the purity of the main product was 85% and that it needed to be assessed using qualitative tools rather than RI-based methods. Further method development and improvements are needed to use RI as a quantitative PAT tool to ensure complete couplings. They also repeated the cleavage step in a more controlled manner and showed that the sensitivity of RI was sufficient in detecting the cleavage of the smallest oligonucleotide (1-mer).
Dr. Lopez presented a table showing how the RI-based method they developed provided a new level of process control over SPOS. In the case of deblocking and cleavage/deprotection steps, the RI-based method provides an alternative to the existing UV-VIS-based methods. He emphasized the importance of having two different ways of looking at the same image to understand reality. Combining these two sources of information about the same process allows comparisons to be made and logical conclusions to be drawn. In addition to the existing capabilities of UV-VIS, the RI-based method provided a new level of control steps such as coupling and support washing.
Dr. Lopez mentioned the challenges and opportunities of the RI-based method to follow SPOS. He said the large size of the refractometers, the temperature dependence of the method and the need for temperature correction, the standard instrument software, which is not optimized for SPOS, and the qualitative nature of the data, although qualitative predictions are possible. Furthermore, the applicability of the method to SPOS, especially specification steps and sensor systems in automatic synthesizers, includes the sustainability exemplified by support washes (no more or less than needed), the innovative side of the detection method, and its potential in business.